

When you press a key and wait for code completion, how much latency can you truly tolerate?
Back
When you press a key and wait for code completion, how much latency can you truly tolerate?
Human-computer interaction research indicates that 100ms is the boundary for "instant response," while 400ms is the inflection point where productivity begins to decline. Beyond one second, users shift from flow state to frustration. Code completion is uniquely latency-sensitive due to its high-frequency triggers and direct competition with manual typing. We categorize the experience into four levels:
Why target 300ms? Users typically type with 200–400ms intervals between keystrokes. Responding within 300ms ensures suggestions appear before the next keystroke, providing a vital buffer for network fluctuations. However, executing context collection, model inference, result ranking, and UI rendering within this window is a massive engineering challenge. This article reveals how Qoder NEXT achieves millisecond-level completion through end-to-end optimization.
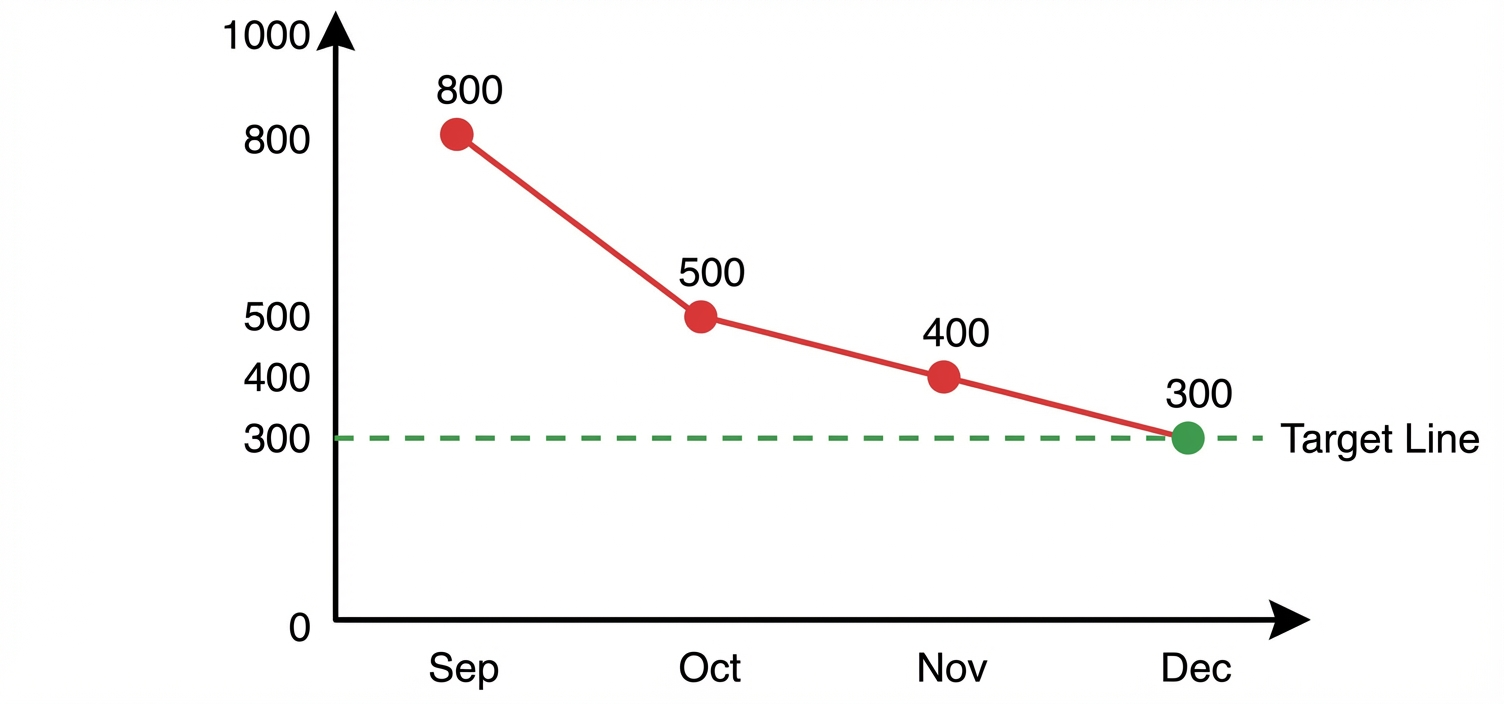
Before diving into the technical mechanics, let's look at the impact: we have successfully reduced P50 latency from 800ms to 300ms, breaking through the critical experience threshold for the vast majority of our users.
It is vital to distinguish between First Token (the first character generated) and First Action (the first semantically complete, adoptable snippet). Users care about the latter.
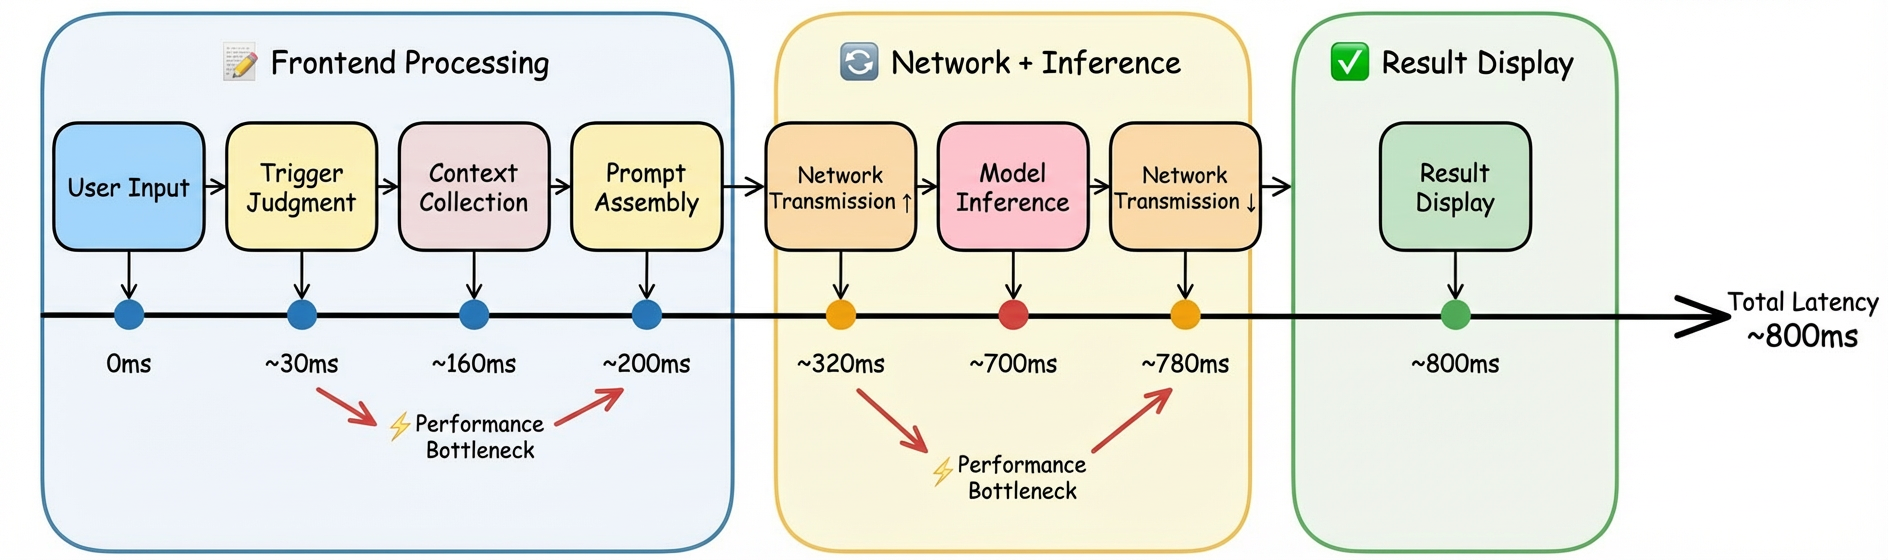
Before optimization, we analyzed millions of requests to identify the primary bottlenecks:
Latency breakdown by stage:
We optimized two core phases: Prefill (affecting Time To First Token - TTFT) and Decoding (affecting Generation Speed - TPS).
User input continuously changes in code completion, reducing KV Cache affinity. We implemented:
Qoder NEXT requires multi-dimensional data: AST structures, project symbol tables, and semantic Embedding vectors.
To prevent time-consuming file system reads in large projects, we designed a three-tier cache:
Collecting heavyweight context (like LSP dependencies) takes 100–300ms. If we wait for a trigger to start, latency is inevitable. Instead, we collect while typing, preloading data during natural pauses:
Rather than waiting for a full HTTP response, we use HTTP/2 streams to push tokens as they are generated.
User editing behavior is not always linear. In scenarios like input deletion, undo/redo, cursor jumping, the context is often highly similar to the way it was before. We leverage this characteristic to short-term cache completion results.
To balance hit rate and memory usage, we designed an intelligent cache eviction strategy:
We are exploring knowledge distillation to create lighter, specialized models that can be dynamically selected based on complexity, as well as INT4 quantization for further hardware-level acceleration.
Our ultimate goal is a "zero-wait" experience. By analyzing editing trajectories, NAP aims to compute results in the background before the user even triggers a suggestion, potentially dropping First Action latency to < 100ms.
There is no silver bullet for performance. Qoder NEXT's millisecond-level response is the result of a holistic synergy between model engineering and infrastructure optimization.
We optimized P50 latency from 800ms to 300ms, achieving milestone results. Code completion is a high-frequency, flow-sensitive scenario where every millisecond matters for the experience. We focus not just on the P50, but on the P99—ensuring a smooth experience for every developer.
We believe that the best technology should be invisible. Users don't need to know about the complex optimizations behind the scenes; they just want to enjoy the smoothness when pressing Tab.
Think Ahead, Code Next — Making the wait disappear.
Introduction: The 300ms Experience Threshold
When you press a key and wait for code completion, how much latency can you truly tolerate?
Human-computer interaction research indicates that 100ms is the boundary for "instant response," while 400ms is the inflection point where productivity begins to decline. Beyond one second, users shift from flow state to frustration. Code completion is uniquely latency-sensitive due to its high-frequency triggers and direct competition with manual typing. We categorize the experience into four levels:
| Experience Level | First Action Latency | User Perception |
|---|---|---|
| Excellent | < 300ms | "The system is reading my mind," completely imperceptible |
| Good | 300-500ms | Barely noticeable, flow state maintained |
| Average | 500-700ms | Noticeable lag, starting to impact efficiency |
| Poor | > 700ms | Frustrating, users may abandon usage |
Optimization Results Overview
Before diving into the technical mechanics, let's look at the impact: we have successfully reduced P50 latency from 800ms to 300ms, breaking through the critical experience threshold for the vast majority of our users.
Full-Chain Latency Analysis
Definition of "First Action"
It is vital to distinguish between First Token (the first character generated) and First Action (the first semantically complete, adoptable snippet). Users care about the latter.
- Completeness: Contains enough information for decision-making (not a half-finished fragment).
- Independence: Users can immediately press
Tabto accept or continue typing. - Example: If a user types
const user =, the First Action isawait getUserById(id);—a complete, functional line.
Lifecycle of a Completion Request
Latency Distribution Analysis
Before optimization, we analyzed millions of requests to identify the primary bottlenecks:
| Metric | P50 | P90 | P99 |
|---|---|---|---|
| First Action Latency | 800ms | 1000ms | 1300ms+ |
- Trigger Decision:** 30ms (4%)**
- Context Collection:** 130ms (16%)**
- Prompt Assembly:** 40ms (5%)**
- Network Transfer:** 200ms (25%)**
- Model Inference: 400ms (50%)
Model Inference Acceleration: The Core Battlefield
We optimized two core phases: Prefill (affecting Time To First Token - TTFT) and Decoding (affecting Generation Speed - TPS).
Prefill Optimization (TTFT)
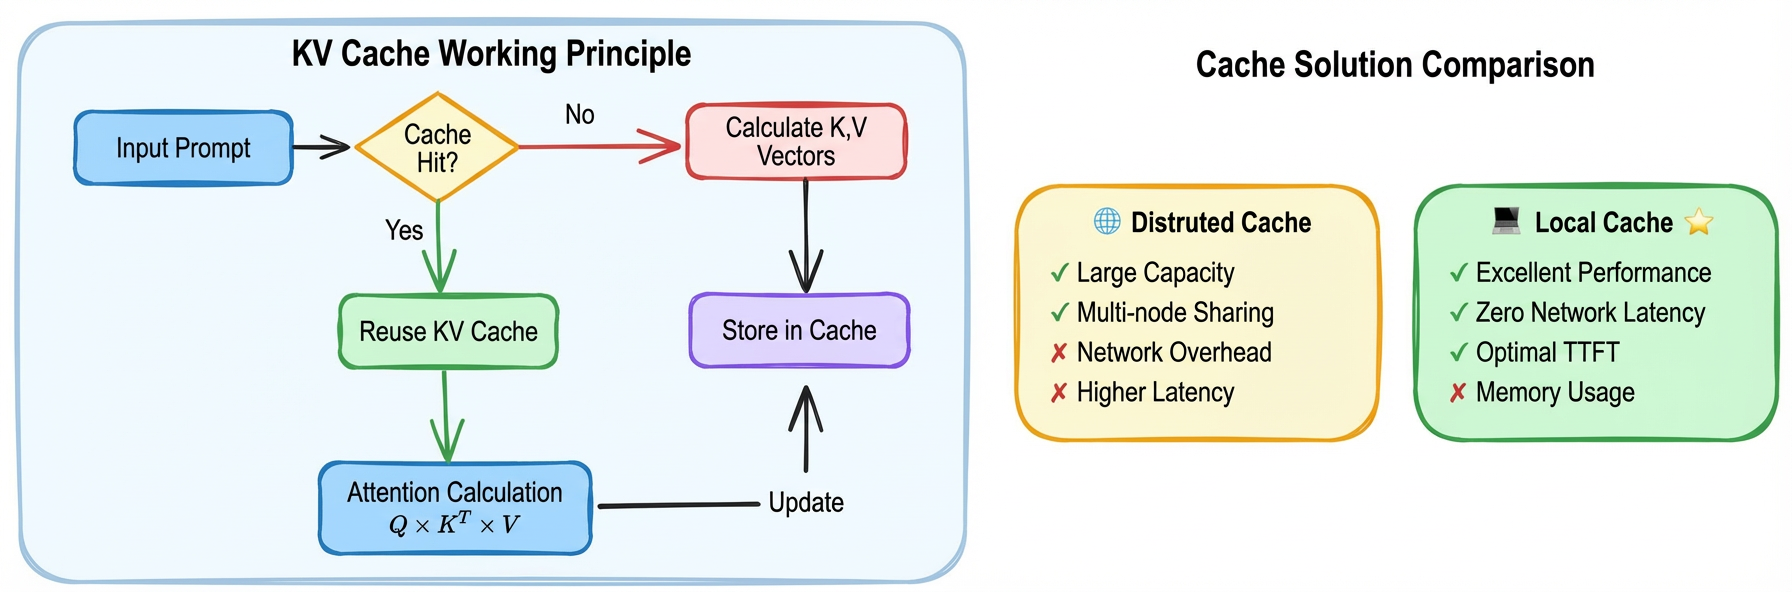
User input continuously changes in code completion, reducing KV Cache affinity. We implemented:
- Prompt Structuring: Optimizing prompt templates to improve KV Cache hit rates by 10%.
- Local KV Cache Scheduling: We chose a local cache approach over distributed architectures to minimize the latency overhead of cache retrieval.
- Parallel Architectures: While Tensor Parallel (TP) improves TTFT, we apply it judiciously based on scenario-specific resource costs.
Decoding Optimization (TPS)
- Quantization and Operator Fusion: We adopted FP8 quantization to balance precision with performance. By fusing mainstream open-source operators, we achieved significant savings in TPOT (Time Per Output Token).
- Speculative Decoding: We utilize a custom-trained "Draft" model to generate candidate sequences, which the large model verifies in batches. This increases TPS without compromising output quality.
Context Collection: Fast and Accurate Gathering
Qoder NEXT requires multi-dimensional data: AST structures, project symbol tables, and semantic Embedding vectors.
Hierarchical Caching
To prevent time-consuming file system reads in large projects, we designed a three-tier cache:
| Cache Level | Content | Hit Condition | TTL | Hit Rate |
|---|---|---|---|---|
| L1 Memory Cache | Active file AST, recent contexts | File unmodified | Session-level | ~45% |
| L2 Project Cache | Symbol tables, dependency graphs | File hash match | While project is open | ~20% |
| L3 Semantic Cache | Code block Embeddings | Confidence check | 24 hours | ~10% |
Asynchronous Collection: Utilizing Keystroke Gaps
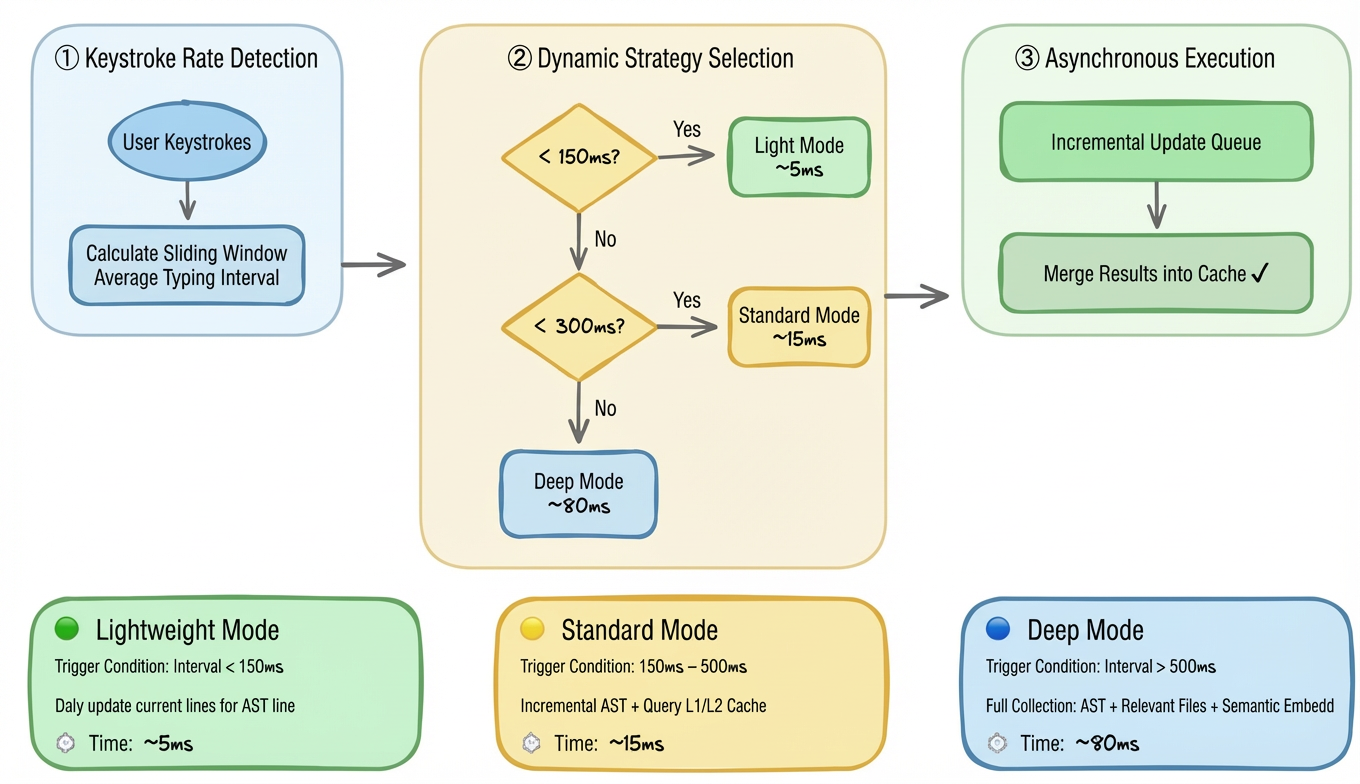
Collecting heavyweight context (like LSP dependencies) takes 100–300ms. If we wait for a trigger to start, latency is inevitable. Instead, we collect while typing, preloading data during natural pauses:
| Typing State | Typical Interval | Available Time Window |
|---|---|---|
| Fast typing | 80-150ms | Update AST near cursor |
| Normal typing | 150-250ms | Incremental parsing + cache queries |
| Thinking/Pausing | 250-500ms | Prefetch related files + semantic analysis |
| Long pause | > 500ms | Full context collection |
Dynamic Adjustment Strategy
We dynamically adjust the depth and scope of context collection based on the user's real-time keystroke rate:Adaptive Learning
The system learns individual habits. For a "fast typist," we raise lightweight mode thresholds; for a "think-while-typing" user, we switch to deep mode more frequently.| User Characteristic | Identification Method | Strategy Adjustment |
|---|---|---|
| Fast typist | Average interval < 120ms | Raise lightweight mode threshold to 180ms |
| Think-while-typing | High interval variance | More frequent switching to deep mode |
| Batch pasting | Large input in short time | Pause collection, wait for stabilization |
Network Transfer and Streaming Output
Reducing Transfer Latency
- Proximity Access: Deploying services across global regions reduced network RT from 200ms to 50ms.
- Global Acceleration: We use dedicated cloud lines to bypass public network congestion, gaining an average 30ms benefit.
| Optimization Measure | Latency Benefit | Description |
|---|---|---|
| Proximity Access | -150ms | Requests routed to nearest node |
| Global Network Acceleration | -30ms | Dedicated line transfer, avoiding public network jitter |
Streaming Output: First Action Priority
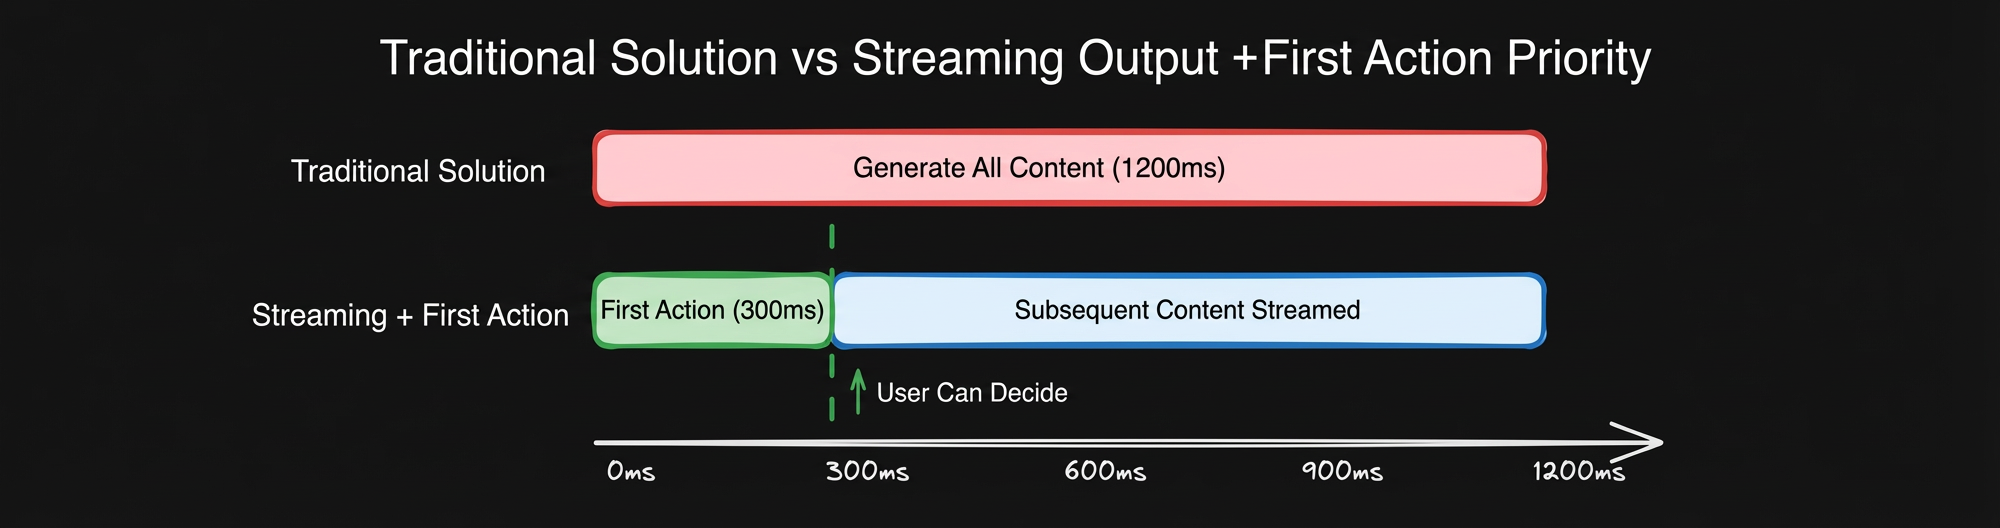
Rather than waiting for a full HTTP response, we use HTTP/2 streams to push tokens as they are generated.
- Traditional Solution: 1200ms (Wait for full generation).
- Streaming + First Action Priority: 300ms (First packet enables immediate user decision).
| Solution | Perceived Latency | Description |
|---|---|---|
| Traditional Solution | 1200ms | Wait for complete generation before returning all at once |
| Streaming + First Action Priority | 300ms | First packet enables decision, subsequent content streams in |
Result Caching and Reuse
When Context Is Unchanged, Results Can Be Reused
User editing behavior is not always linear. In scenarios like input deletion, undo/redo, cursor jumping, the context is often highly similar to the way it was before. We leverage this characteristic to short-term cache completion results.
💡 Approximately 23% of completion requests can hit cache, reducing First Action latency from ~300ms to < 10ms.
Cache Lifecycle Management
To balance hit rate and memory usage, we designed an intelligent cache eviction strategy:
| Strategy | Description |
|---|---|
| Time Window | Cache valid for 30 seconds, auto-expires on timeout |
| Capacity Limit | Maximum 10 cached results per file |
| Active Invalidation | Clear related cache on file save or large-scale edits |
| LRU Eviction | When capacity is insufficient, prioritize evicting least recently hit cache |
📊 Overall Effect: Achieved 23% result reuse rate while keeping memory usage under control.